Getting Started
Let’s build a simple Tableau extension that displays the summary data from Tableau when a user clicks a bar in a bar chart.
First create a new Tableau extension in Anvil by selecting “Blank app” and then “Tableau Extension”:


Download and add a trex file to Tableau
In order to add an extension built in Anvil to Tableau it needs to be added to the dashboard using a .trex file. The trex file is first downloaded from Anvil and then dropped in to your Tableau dashboard.
In Anvil:
Click the green “Test in Tableau” button in the top right.
A popup will appear, click “Click here to download the manifest file for your extension”, the trex file should appear in your downloads.
In Tableau:
Go to the dashboard, drag and drop the “Extension” object wherever you’d like.
In the bottom left of the alert that appears, select “Access Local Extensions” and locate the
.trexfile from step 2.
Write some code
Now that we’re connected to our dashboard let’s add some components and code.
Rename
Form1toMainFormAdd a label to the UI and change its Python name to
label_1Paste the following in the code section of the
MainForm
 1# client_code/MainForm
 2from ._anvil_designer import MainFormTemplate
 3from anvil import *
 4from trexjacket.api import get_dashboard
 5
 6class MainForm(MainFormTemplate):
 7    def __init__(self, **properties):
 8        self.init_components(**properties)
 9        self.dashboard = get_dashboard() # we now have a Python object that represents our dashboard!!
10        self.dashboard.register_event_handler('selection_changed', self.show_selections)
11
12    def show_selections(self, event):
13        print(event.worksheet.selected_records)
14        self.label_1.text = str(event.worksheet.get_selected_marks())
In the form code above, we do 2 important things:
Get the current Tableau dashboard using
get_dashboard. This returns aDashboardobject and contains many useful attributes and methods such as datasources, filters, parameters, and worksheets.Bind the
show_selectionsmethod of our Anvil form to theselection_changedevent of the Tableau dashboard usingregister_event_handler. Theselection_changedevent triggersshow_selectionswhenever the user selects / unselects marks.
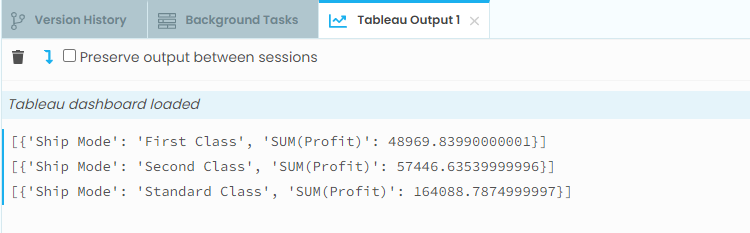
Congrats, you now have a working Tableau extension!
Additionally, output from the print statement appears in the Anvil IDE:
Download the resources!