What’s Anvil X?
Important
Anvil X is a toolkit for building and deploying Tableau extensions entirely in Python and provides a framework and IDE for pure-Python full stack web development. It combines the rapid visual design of “low-code” tools with the power and flexibility of a code-first framework.
What's Anvil?
Anvil is a Python-based, full stack web framework used to rapidly develop and deploy web applications.
What's trexjacket
trexjacket is an open source Python wrapper for the Tableau Extensions API, most easily accessed using Anvil X. It provides a Pythonic interface to the elements on your Tableau dashboard: worksheets, filters, dashboards, and more.
With trexjacket, you can write code like:
 1from trexjacket.api import get_dashboard
 2dashboard = get_dashboard() # <- a Python object that represents a Tableau dashboard
 3dashboard.register_event_handler('selection_changed', handle_selection)
 4
 5def handle_selection(event):
 6  selection = event.get_selected_marks()
 7  print(f'The user chose: {selection}')
 8
 9  for ds in dashboard.datasources:
10    ds.refresh()
11
12  dashboard.get_worksheet('Sale Map').apply_categorical_filter('State', ['MI', 'WI'])
13  dashboard.get_parameter('Salary Cap') = 50000
What's a Tableau extension?
In Tableau’s own words,
“The Extension API enables customer to integrate and interact with data from other applications directly in Tableau”
...in other words
Tableau dashboard extensions are web applications that have two-way communication with the dashboard. They enable all sorts of scenarios, like letting you integrate Tableau with custom applications, making possible for you to modify the data for a viz, or even creating custom visualizations inside the dashboard.

What can you do with an extension?
Because Tableau extensions are web applications, there is a wide variety of different things you can do with them. Things like:
Integrate with third-party APIs inside the dashboard
Use third-party charting libraries like
visjsord3to add custom visualizationsEnable write-back functionality so users can modify data in a viz and have that change automatically update the source data
Build custom viz and interactivity types, such as a filter replacement and custom interfaces
To get a taste of what other people have built, check out some dashboard extensions on the Tableau Exchange
The Objective of Anvil X: Investment to Insight
The primary purpose of Anvil X is to reduce the amount of time from investment to insight.
By making Tableau Extensions more accessible to organizations, Dashboard Developers are unleashed to do more. “More” includes new integrations, sophisticated user interfaces, and more advanced data tools.
Anvil X does this by:
Creating a Pythonic representation of the Tableau Dashboard
Enabling one-Click extension deployment
A modern, efficient development experience
Enterprise-ready user management and access controls
Transparent, real-time logging and error handling
Secure Server environment
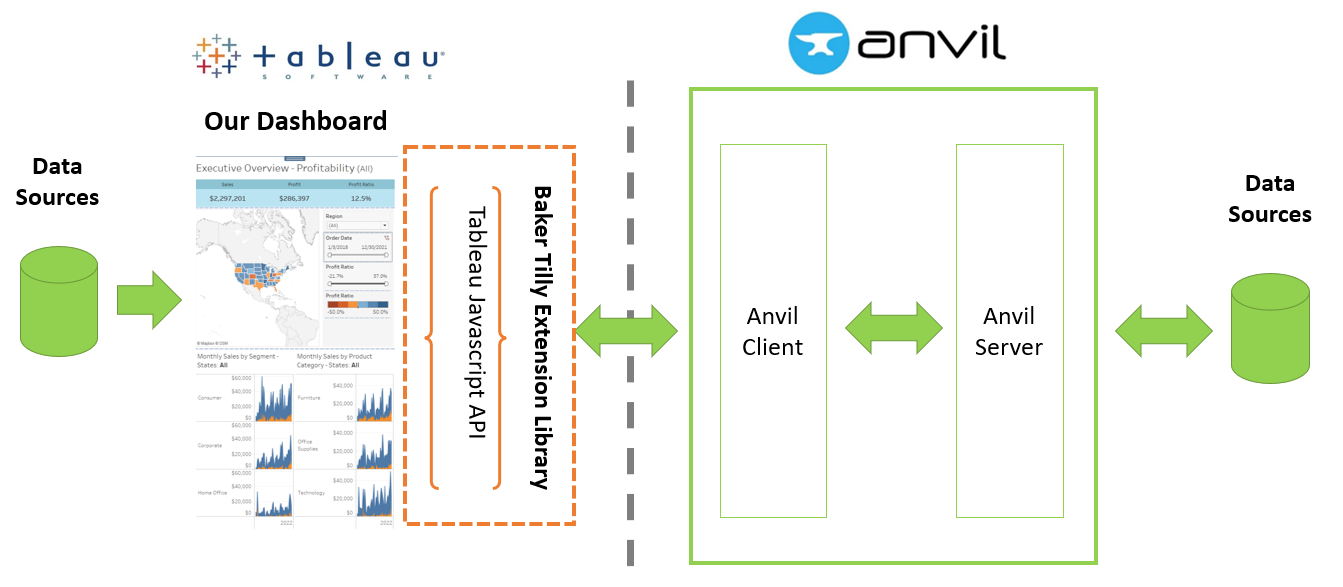
The below image outlines how this Python library is related to Anvil and Tableau.
Eager to build something?
Consider following the Building a Chat Extension tutorial where you’ll build your first Tableau Extension with Anvil X!